Introduction
Data science alone is pretty useless.
If you’re bothering to pick up a book on data science, you probably love writing elegant Python or R code. Or maybe you have a passion for beautiful data visualizations. Or perhaps you find joy in tuning machine learning models.
Ultimately – frustratingly – these things don’t matter.
What does matter is whether your work is useful. That is, whether it affects decisions at your organization or in the broader world.
That means you must share your work by putting it in production.
Many data scientists think of in production as an exotic state where supercomputers run state-of-the-art machine learning models run over dozens of shards of data, terabytes each. There’s a misty mountaintop in the background, and there’s no Google Sheet, CSV file, or half-baked database query in sight.
But that’s a myth. If you’re a data scientist putting your work in front of someone else’s eyes, you are in production. And, I believe, if you’re in production, this book is for you.
You may sensibly ask who I am to make such a proclamation.
In 2019, I left a role leading a data science team to join the Solutions Engineering team at Posit (then RStudio). The Solutions Engineering team helps customers deploy, install, configure, and use Posit’s Professional Products.
As such, I’ve spoken with hundreds of organizations managing data science in production about what being in production means for them. I’ve helped them make their systems for developing and sharing data science products more robust with open-source tooling and Posit’s Professional Products.
I’ve seen organizations at every level of data science maturity. For some organizations, in production means a report that gets rendered and emailed around. For others, it means hosting a live app or dashboard that people visit. For the most sophisticated, it means serving live predictions to another service from a machine learning model via an application programming interface (API).
Regardless of the maturity or the form, every organization wants to know that the work is reliable, the environment is safe, and that the product will be available when people need it.
And that’s what this book is about – all of the stuff that is not data science that it takes to deploy a data science product into production.
The good news is that there’s existing prior art. DevOps is an outgrowth of software engineering primarily concerned with these problems and where we, as data scientists, can learn some important lessons.
DevOps for Agile software
DevOps is a set of cultural norms, practices, and tooling to help make developing and deploying software smoother and lower risk.
If that definition strikes you as unhelpfully vague, you’re right.
DevOps is a squishy concept, much like the closely related Agile software development process. That’s partially because DevOps isn’t a fixed thing. It’s the application of some principles and ideas about process to whatever context you’re working in. That malleability is why DevOps works, but it makes it difficult to pin down.
The ecosystem of companies selling DevOps tools furthers this imprecision. There are dozens and dozens of companies proselytizing their particular flavor of DevOps – one that (shocker) reflects the capabilities of their product.
But, there are some precious lessons to learn underneath the industry hype and the marketing jargon.
To understand better, let’s go back to the birth of DevOps. As the story goes, the history of software development before the 1990s involved a waterfall development process. Software developers worked with clients and customers to fully define project requirements, plan the entire development process, and deliver completed software months or years later.
When the application was complete, it was hurled over the metaphorical wall from Development to Operations. Professionals in the Ops department would figure out the hardware and networking requirements, get it running, and maintain it.
This working method came with a lot of problems. It was hard to estimate how long each bit of work would take and to divine how the finished software should look and work ahead of time. Software developers observed that delivering working software in small units, quickly collecting feedback, and iterating was a more effective model.
In 2001, the Manifesto for Agile Software Development was published, giving a name to this new software development philosophy. Agile development ate the world. Essentially all software is now developed using some form of Agile. Agile work patterns have also extended beyond software into more general project management.
You may have heard of some of the dozens of Agile software development frameworks, including Scrum, Kanban, Extreme Programming (XP), and many, many more. These frameworks laid out effective software development methods, but a question remained. What should happen once the software is written?
The old pattern clearly wouldn’t work. If you were writing code in small chunks that resulted in new deployments multiple times a week – or even a day – you needed a way to get software into production that complemented Agile software development.
DevOps arose as this discipline, i.e., a way for Dev and Ops to better collaborate on the process that would take software from development into production. It took a little while for the field to be formalized, with the term DevOps coming into common usage around 2010.
Processes and people
Throughout this book, DevOps refers to the knowledge, practices, and tools that make it easier, safer, and faster to put work into production. So, if you’re a software developer (and as a data scientist, you are), you need to be thinking about DevOps.
Most organizations also have a set of people and roles who have the permission and responsibility for managing their organization’s servers and software. Their titles vary. They might be named Information Technology (IT), SysAdmin, Site Reliability Engineering (SRE), or DevOps.1
For simplicity, I will use the term IT/Admin to refer to these people and teams throughout this book.
As a data scientist, you are the Dev, so a huge part of making DevOps work for you is finding IT/Admin counterparts with whom you can collaborate. In some cases, that will be easier than others. Here are three patterns that are almost always red flags – mainly because they make it hard to develop durable relationships to sustain the kind of collaboration DevOps requires.
At some large organizations, IT/Admin functions are split into small atomic units like security, databases, networking, storage, procurement, cloud, and more. This is useful for keeping the scope of work manageable for the people in that group and often yields deep technical expertise. But, it also can be slow to get anything done because you’ll need to bring people together from disparate teams.
Some organizations have chosen to outsource their IT/Admin functions. While the individuals in those outsourced teams are often competent, building relationships can be difficult. Outsourced IT/Admin teams are often in India, so it can be hard to find meeting times with American and European teams. Additionally, turnover on projects and systems tends to be high, so institutional knowledge is thin, and relationships can’t be relied on for the long term.
Some organizations, especially small or new ones, don’t have an IT/Admin function. At others, the IT/Admins are preoccupied with other tasks and lack the capacity to help the data science team. This isn’t a tragedy, but it probably means you’ll have to become the IT/Admin if you want to get anything done.
Whether your organization has an IT/Admin setup that facilitates DevOps best practices or not, this book can help you take the first steps toward making your path to production smoother and simpler.
A data science platform
A lot of data science is done on personal computers. Data scientists download Jupyter Notebook or RStudio, install Python and R, and get to work. However, organizations are increasingly consolidating data science operations onto a centralized data science platform or data science environment.
It’s easier to secure connections between a centralized platform and data sources compared to providing access to everyone’s laptops. Similarly, providing more computational resources is much easier in a centralized environment compared to distributing new laptops.
There are two essential components of an organizational data science platform. The first is the workbench. This is where data scientists go to get work done. It has Python, R, data access, sufficient computational resources, and the open-source Python and R packages you need to do work.
A good workbench drastically speeds onboarding for the data science team. Compared to the days, weeks, or months to provide each laptop access to each data source, adding a new person to the platform takes minutes, and they arrive with all of their tools pre-provisioned.
Once data science projects are complete, they need to go somewhere to be shared. That means the data science environment needs to include a deployment platform where data science projects can be hosted and shared with other people and systems.
In most organizations, especially enterprises, everything in the data science environment will also be subject to access control to ensure that only the right people and systems have access.
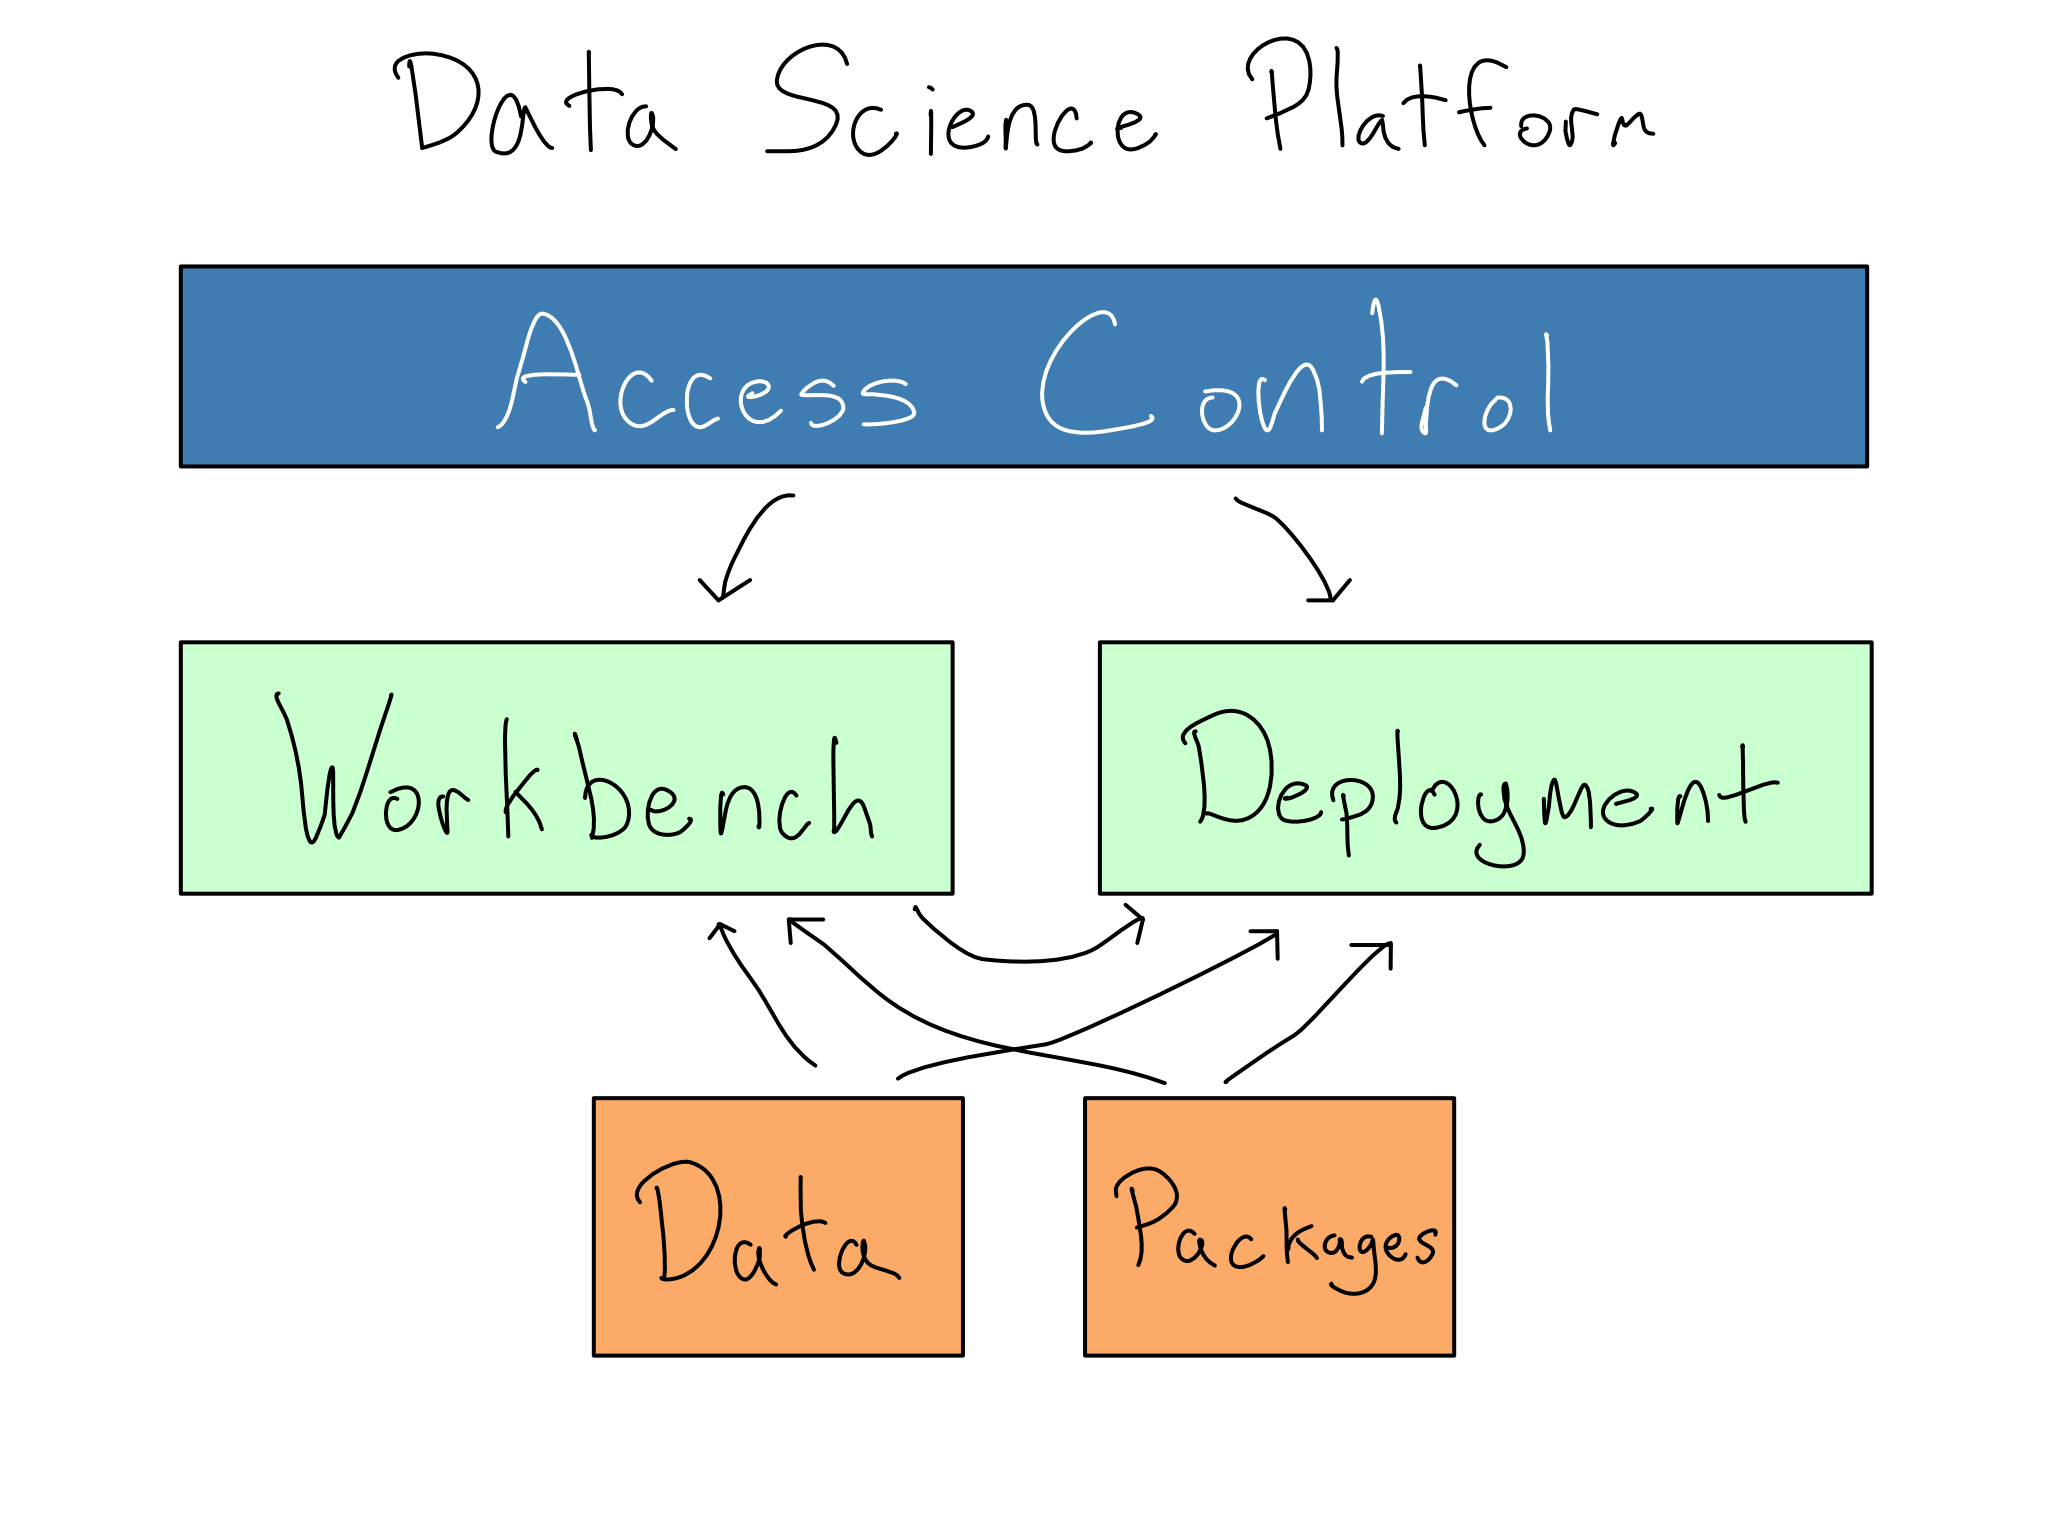
This book will help you understand the needs of each component of the data science platform and how to articulate them to the IT/Admins at your organization who will help you get one.
About this book
While engaging with many organizations, I’ve seen which patterns grease the path to production for data scientists and which tend to impede it.
My goal is that this book helps you create data science projects that are easier and simpler to deploy and that you have the knowledge and skills to get them into production when it’s time.
To that end, this book is divided into three parts.
Part 1 is about applying DevOps best practices to a data science context. Adhering to these best practices will make it easier to take projects into production and ensure their security and stability once they’re there. While these best practices are inspired by DevOps, data science and data science projects are different enough from general-purpose sofware engineering that some re-thinking is required.
Part 2 is a walkthrough of basic concepts in IT Administration that will get you to the point of being able to host and manage a basic data science environment. If you are a hobbyist or have only a small data science team, this might make you able to operate without any IT/Admin support. Even if you work at an organization with significant IT/Admin support, it will equip you with the vocabulary to talk to the IT/Admins at your organization and some basic skills of how to do IT/Admin tasks yourself.
Part 3 is about how everything you learned in Part 2 is inadequate at organizations that operate at enterprise scale. If Part 2 explains how to do IT/Admin tasks yourself, Part 3 is my attempt to explain why you shouldn’t.
Comprehension questions
Each chapter in this book includes comprehension questions. As you get to the end of the chapter, take a moment to consider these questions. If you feel comfortable answering them, you’ve probably understood the chapter’s content.
I’ll frequently discuss building mental models throughout the book. A mental model is an understanding of each of the components in a system and how they fit together.
A mental map is a way to represent mental models. In a mental map, you draw each entity in the system as a node in a graph and connect them with labeled arrows to explain the relationship.
Mental maps are a great way to test your mental models, so I’ll suggest them as comprehension questions in many chapters.
Here’s an example for this book:
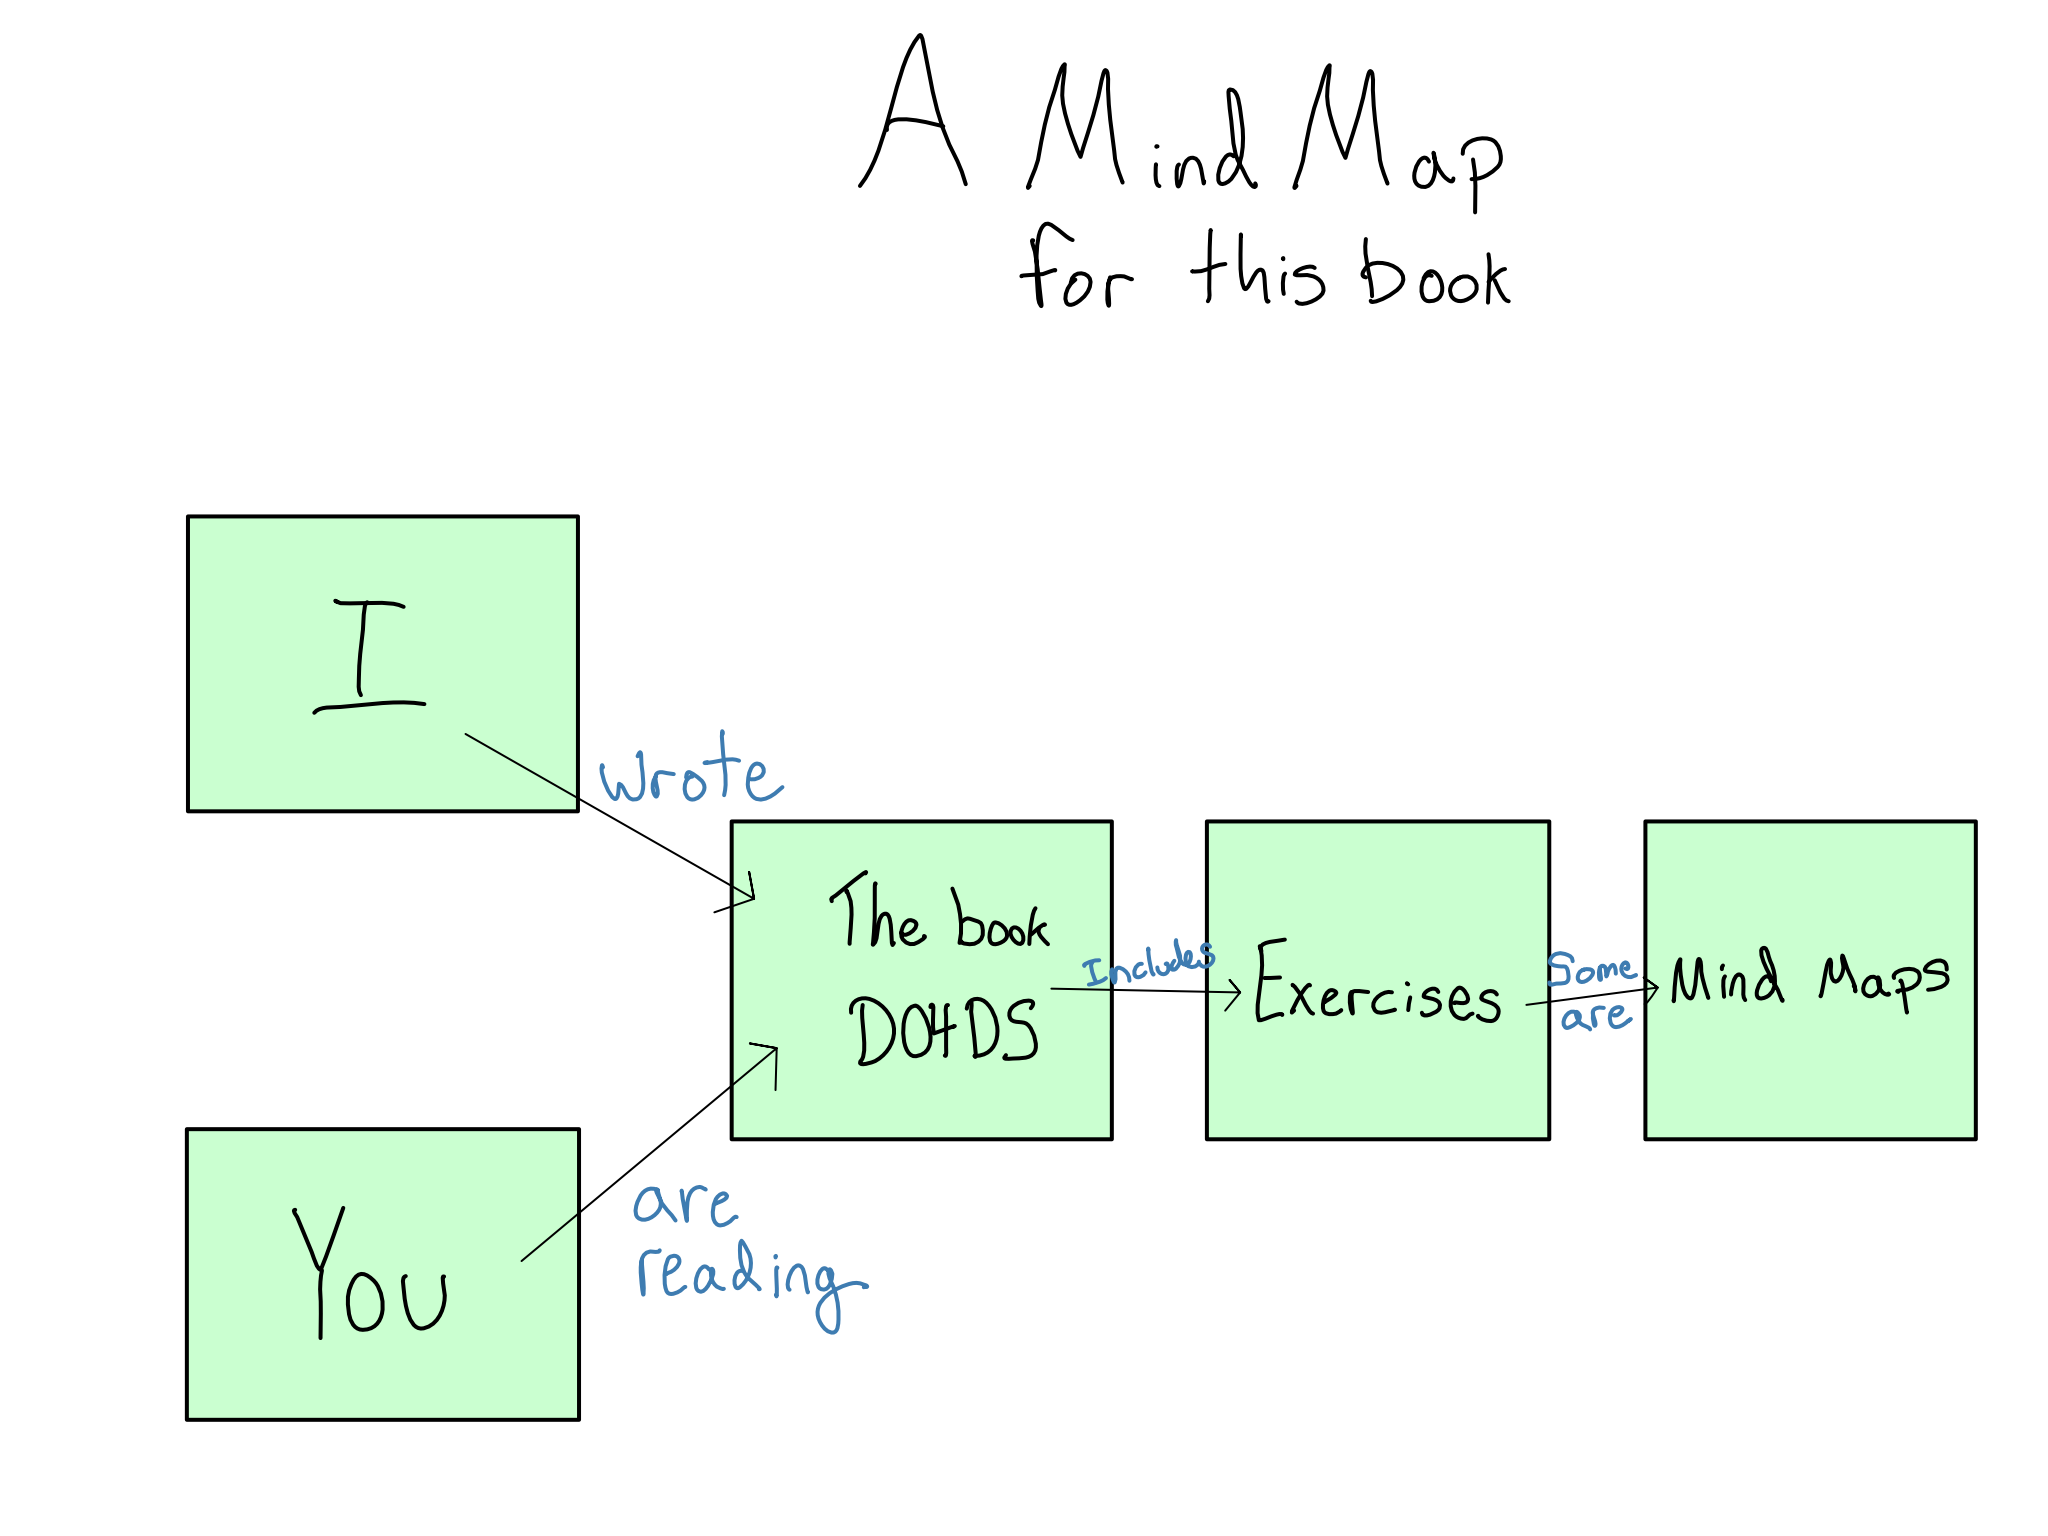
Note how every node is a noun (or pronoun), and the edges (labels on the arrows) are verbs. You’ve probably understood the content if you can write down the relationships in this compact form.
Labs
Many chapters also contain labs. The idea of these labs is to give you hands-on experience with the concepts at hand.
These labs all tie together. If you follow the labs, you’ll build up a reasonably complete data science platform, including a data science workbench and a deployment platform.
In the labs, we’ll use the Palmer Penguins data, a public dataset meant to demonstrate data exploration and visualization. We’re going to pretend we care deeply about the relationship between penguin bill length and mass, and we’re going to build up an entire data science environment dedicated to exploring that relationship.
The front end of this environment will be a website built with the Quarto publishing system. It will include an app for fetching penguin mass predictions from a machine learning model based on bill length and other features. The website will also have pages dedicated to exploratory data analysis and model building.
On the backend, we will build a data science workbench on an AWS EC2 instance where we can do this work. It will include RStudio Server and JupyterHub for working. It will also host the machine learning model as an API and the Shiny app for the website.
The whole thing will get auto-deployed from a Git repo using GitHub Actions.
From an architectural perspective, it’ll look something like this:
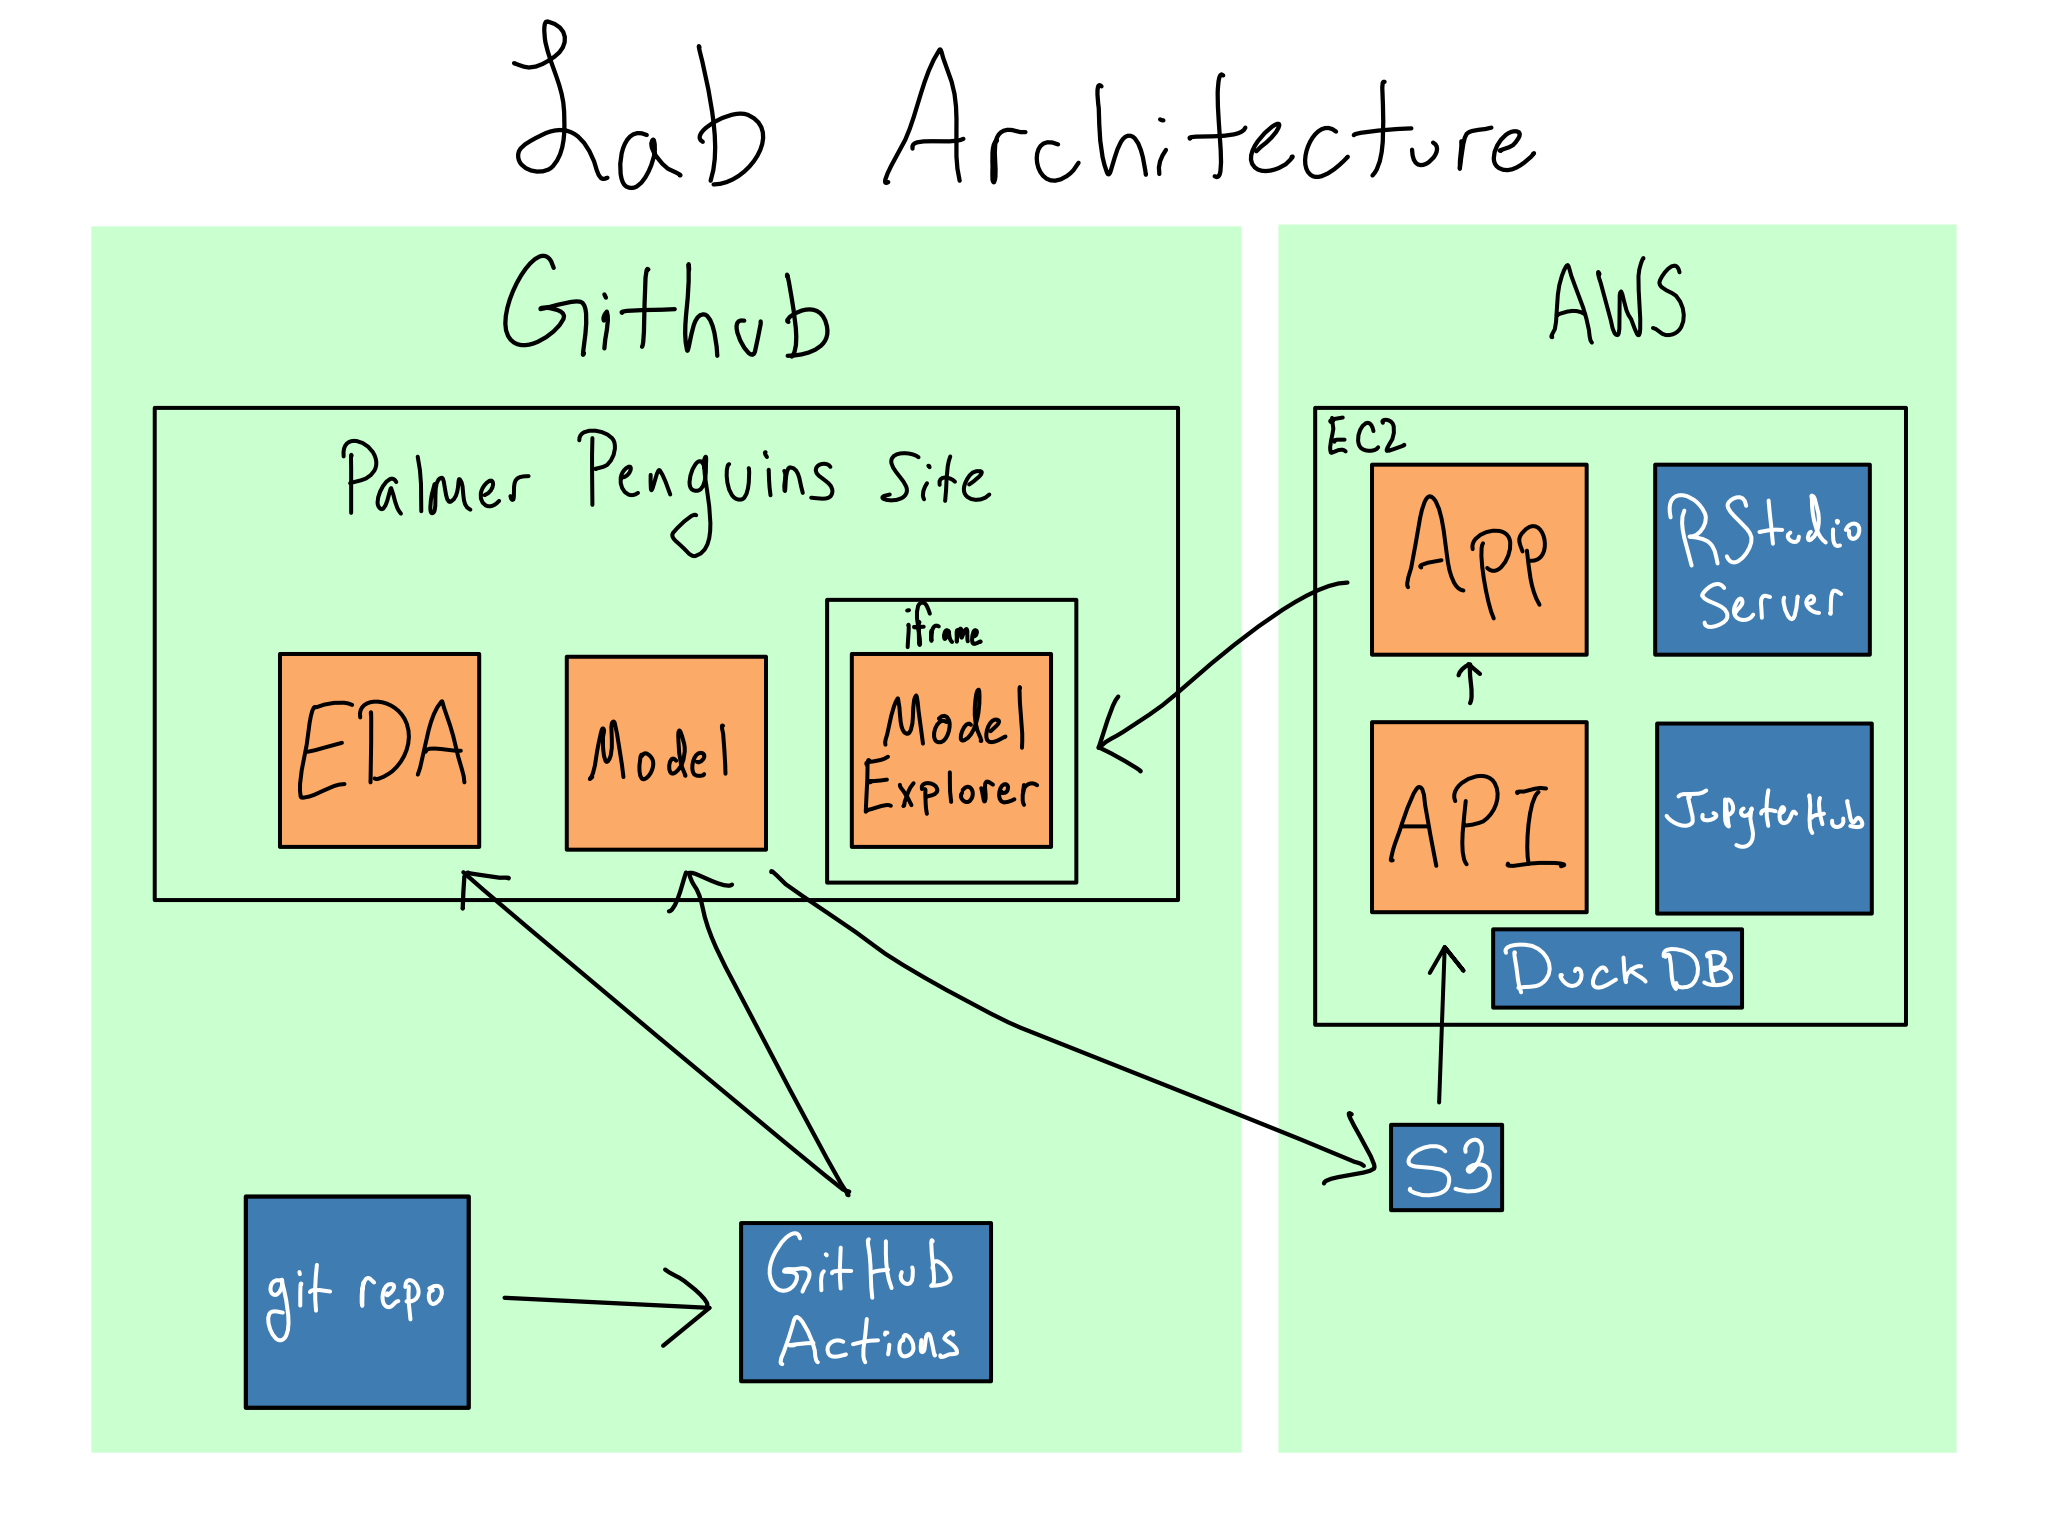
If you’re interested in which pieces are completed in each chapter, check out Appendix C.
Conventions
Throughout the book, I will italicize both the names of other publications and terms of art when introducing them. For many technical terms, the abbreviation or acronym is the real term and the entire name is just trivia. Therefore, I will sometimes buck typographical standards and put the abbreviation in text and the full name in parentheses upon introduction.
Bolding will be reserved for emphasis.
R and Python packages will appear inside braces in code font like {package}, and system commands will be in code font. Networking concepts and terms, including URLs, will appear in \(\text{equation font}\).
Variables you would replace with your values will appear in code font inside angled brackets, like <your-variable>.
I think a lot of DevOps experts would argue that you’re doing DevOps wrong if you have a standalone DevOps team, but such teams exist.↩︎